> ## Documentation Index
> Fetch the complete documentation index at: https://docs.palagus.ai/llms.txt
> Use this file to discover all available pages before exploring further.
# Brand Performance
Your Overview is the main dashboard for understanding how your brand performs across AI-generated responses.
It combines your most important metrics, competitor rankings, and performance breakdowns in one place.
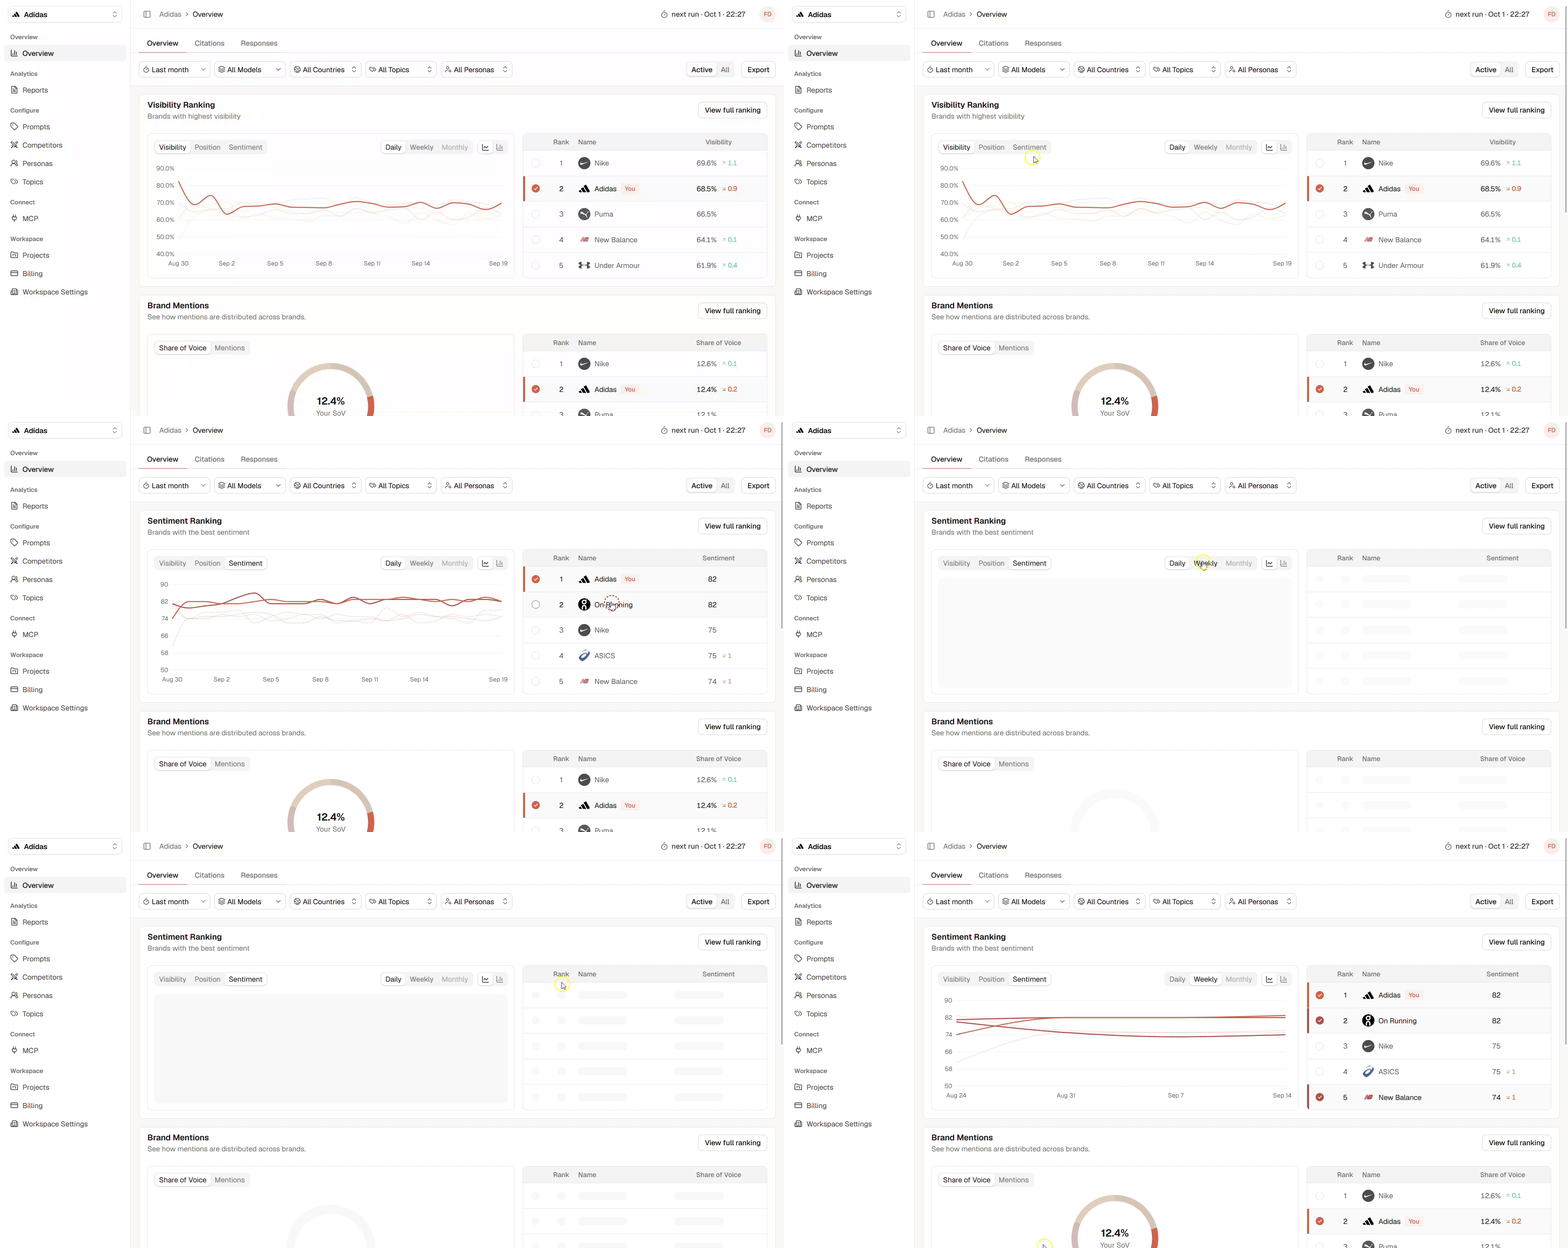 ## Dashboard Filters
Use the filters at the top of the page to focus your analysis:
* **Date range:** Select the period you want to analyze.
* **Models:** Compare all AI models or select a specific platform.
* **Countries:** Focus on responses generated for selected countries.
* **Topics:** Analyze specific groups of prompts.
* **Personas:** See how performance differs between audiences.
* **Active / All:** Include only active prompts or all available prompts. When **All** is activated, all prompts that are active and all archived prompts from the past will be included.
All sections of the Performance update based on your selected filters.
## Visibility Ranking
The Visibility Ranking compares how frequently your brand and competitors appear in AI-generated responses.
The chart shows how performance changes over time, while the ranking shows the current results for each brand.
You can switch between:
* **Visibility:** How often each brand appears.
* **Position:** Where each brand appears within responses.
* **Sentiment:** How positively or negatively each brand is described.
Use the daily, weekly, and monthly views to identify short-term changes or longer-term trends.
Select a brand in the ranking to highlight its performance in the chart. Choose **View full ranking** to see all tracked brands.
## Brand Mentions
Brand Mentions shows how attention is distributed between your brand and its competitors.
Switch between:
* **Share of Voice:** Your brand’s share of all tracked brand mentions.
* **Mentions:** The total number of times each brand appears.
The chart provides a visual comparison, while the ranking shows the exact result for every brand.
A high Share of Voice means your brand receives a larger part of the tracked conversation. It does not necessarily mean that the brand appears earlier or is described more positively.
## Position Segments
Position Segments show where your brand appears within AI-generated responses.
Palagus measures Position from **0 to 10**:
* **10** represents the beginning of the response.
* **0** represents the end of the response.
Responses are grouped into:
* **Top**
* **Middle**
* **Bottom**
The average Position summarizes the overall placement of your brand. Use the segments to understand whether mentions are consistently prominent or distributed across different parts of the responses.
## Sentiment Segments
Sentiment Segments show how AI models describe your brand.
Responses are grouped into:
* **Good**
* **Neutral**
* **Negative**
The overall Sentiment score summarizes the perception of your brand across the selected responses.
Review the underlying responses to understand which statements, strengths, or limitations influence the result.
## Model Visibility
Model Visibility compares your brand’s Visibility across the monitored AI platforms.
Use this section to identify:
* Which models mention your brand most frequently
* Where your brand performs below average
* Whether your Visibility is consistent across platforms
Differences between models are expected because each platform can generate different answers for the same prompt.
## Topic Visibility
Topic Visibility shows which topics generate the strongest presence for your brand.
Use this breakdown to discover:
* Topics strongly associated with your brand
* Areas where your brand has limited Visibility
* Topics that require deeper prompt analysis
* Opportunities to improve your content or positioning
## Persona Visibility
Persona Visibility shows how frequently your brand appears for different audiences.
A brand may perform strongly for one persona but remain less visible for another.
Use this section to identify:
* Audiences where your brand is already established
* Personas with weaker brand presence
* Audience-specific content opportunities
* Differences in competitive performance
## Understanding Changes
The arrows next to a value show how the result changed compared with the previous comparable period.
* An upward arrow indicates an increase.
* A downward arrow indicates a decrease.
* The number shows the size of the change.
A change should not be evaluated in isolation. Use the filters and open the related prompts or responses to understand what caused it.
This documentation is built and hosted on [Mintlify](https://mintlify.com), a developer documentation platform.
## Dashboard Filters
Use the filters at the top of the page to focus your analysis:
* **Date range:** Select the period you want to analyze.
* **Models:** Compare all AI models or select a specific platform.
* **Countries:** Focus on responses generated for selected countries.
* **Topics:** Analyze specific groups of prompts.
* **Personas:** See how performance differs between audiences.
* **Active / All:** Include only active prompts or all available prompts. When **All** is activated, all prompts that are active and all archived prompts from the past will be included.
All sections of the Performance update based on your selected filters.
## Visibility Ranking
The Visibility Ranking compares how frequently your brand and competitors appear in AI-generated responses.
The chart shows how performance changes over time, while the ranking shows the current results for each brand.
You can switch between:
* **Visibility:** How often each brand appears.
* **Position:** Where each brand appears within responses.
* **Sentiment:** How positively or negatively each brand is described.
Use the daily, weekly, and monthly views to identify short-term changes or longer-term trends.
Select a brand in the ranking to highlight its performance in the chart. Choose **View full ranking** to see all tracked brands.
## Brand Mentions
Brand Mentions shows how attention is distributed between your brand and its competitors.
Switch between:
* **Share of Voice:** Your brand’s share of all tracked brand mentions.
* **Mentions:** The total number of times each brand appears.
The chart provides a visual comparison, while the ranking shows the exact result for every brand.
A high Share of Voice means your brand receives a larger part of the tracked conversation. It does not necessarily mean that the brand appears earlier or is described more positively.
## Position Segments
Position Segments show where your brand appears within AI-generated responses.
Palagus measures Position from **0 to 10**:
* **10** represents the beginning of the response.
* **0** represents the end of the response.
Responses are grouped into:
* **Top**
* **Middle**
* **Bottom**
The average Position summarizes the overall placement of your brand. Use the segments to understand whether mentions are consistently prominent or distributed across different parts of the responses.
## Sentiment Segments
Sentiment Segments show how AI models describe your brand.
Responses are grouped into:
* **Good**
* **Neutral**
* **Negative**
The overall Sentiment score summarizes the perception of your brand across the selected responses.
Review the underlying responses to understand which statements, strengths, or limitations influence the result.
## Model Visibility
Model Visibility compares your brand’s Visibility across the monitored AI platforms.
Use this section to identify:
* Which models mention your brand most frequently
* Where your brand performs below average
* Whether your Visibility is consistent across platforms
Differences between models are expected because each platform can generate different answers for the same prompt.
## Topic Visibility
Topic Visibility shows which topics generate the strongest presence for your brand.
Use this breakdown to discover:
* Topics strongly associated with your brand
* Areas where your brand has limited Visibility
* Topics that require deeper prompt analysis
* Opportunities to improve your content or positioning
## Persona Visibility
Persona Visibility shows how frequently your brand appears for different audiences.
A brand may perform strongly for one persona but remain less visible for another.
Use this section to identify:
* Audiences where your brand is already established
* Personas with weaker brand presence
* Audience-specific content opportunities
* Differences in competitive performance
## Understanding Changes
The arrows next to a value show how the result changed compared with the previous comparable period.
* An upward arrow indicates an increase.
* A downward arrow indicates a decrease.
* The number shows the size of the change.
A change should not be evaluated in isolation. Use the filters and open the related prompts or responses to understand what caused it.
This documentation is built and hosted on [Mintlify](https://mintlify.com), a developer documentation platform.